SMC Academy [PhenLabs]📊 SMC Academy
Version: PineScript™ v6
📌 Description
The SMC Academy indicator is a comprehensive educational tool designed to demystify Smart Money Concepts (SMC) for traders of all levels. Unlike standard indicators that simply print signals, this script uses a “Learning Phase” system that allows users to toggle between individual concepts—such as Market Structure, Liquidity, Imbalances, and Order Blocks—or view them all simultaneously. It lets you focus on one piece of the puzzle at a time.
🚀 Points of Innovation
Progressive Learning Modes: Toggle between 5 distinct phases to master concepts individually before using the Full Strategy Mode.
Educational Tooltips: Hover over labels to read detailed explanations of why a BOS, MSS, or Liquidity zone was identified.
Smart Filtering: Uses ATR and Volume integration to filter out low-quality Fair Value Gaps and weak Order Blocks.
HTF Dashboard: A built-in panel analyzes Higher Timeframe (4H) data to ensure you are trading in alignment with the broader trend.
🔧 Core Components
Market Structure Engine: Automatically detects Swing Highs and Lows to map out market direction using configurable swing lengths.
Liquidity Manager: Identifies unmitigated swing points that serve as Buy-Side (BSL) and Sell-Side (SSL) liquidity magnets.
Imbalance Detector: Highlights Fair Value Gaps (FVG) where price inefficiencies exist, using ATR thresholds to ignore noise.
Order Block Identifier: Locates the specific candles responsible for structure breaks, validated by volume analysis.
🔥 Key Features
Break of Structure (BOS): Automatically marks trend continuation signals with solid lines and color-coded labels.
Market Structure Shift (MSS): Identifies potential trend reversals when significant swing points are breached.
Dashboard Context: Displays the current trend direction and the 4H context directly on your chart.
Custom Alerts: Built-in alert conditions for structure breaks and new Order Blocks allow for automated tracking.
🎨 Visualization
Structure Lines: Solid lines indicate confirmed breaks (Green for Bullish, Red for Bearish).
Liquidity Zones: Dotted lines extending rightward indicate resting liquidity levels that price may target.
FVG Boxes: Shaded boxes highlight imbalance zones, automatically extending for a user-defined number of bars.
Dashboard: A clean, non-intrusive table in the top-right corner displays trend status and active mode.
📖 Usage Guidelines
Setting Categories
Learning Mode: Select from ‘1. Market Structure’ through ‘5. Full Strategy Mode’ to filter what appears on the chart.
Swing Detection Length: Default (5). Determines the sensitivity of the swing high/low detection.
Structure Break Type: Options (Close/Wick). Choose whether a candle close or just a wick is required to confirm a break.
Min FVG Size: Default (0.5 ATR). Filters out gaps smaller than this multiplier to reduce noise.
Filter Weak OBs by Volume: Default (True). Only highlights Order Blocks where volume exceeds the 20-period average.
✅ Best Use Cases
Educational Study: Isolate “Phase 1: Market Structure” to practice identifying trend changes without distraction.
Trend Following: Use “Phase 3: Imbalances” to find entry points within an established trend.
Reversal Trading: Combine “Phase 2: Liquidity” and “Phase 4: Order Blocks” to catch reversals at key levels.
⚠️ Limitations
Subjectivity: Market structure can be interpreted differently depending on the swing length settings used.
Ranging Markets: Like all trend-following concepts, false BOS/MSS signals may generate during choppy, sideways price action.
Repainting: While the signals are non-repainting once confirmed, the live candle may flash a signal before the close if “Close” mode is selected.
💡 What Makes This Unique
Interactive Learning: The inclusion of tooltip explanations transforms this from a simple tool into an active mentor.
Phase-Based Workflow: The ability to strip the chart back to basics at the click of a button is unique to the PhenLabs ecosystem.
🔬 How It Works
Swing Analysis: The script calculates pivot highs and lows based on your length input to define the structural landscape.
Break Validation: It checks if price crosses these pivot points to trigger BOS (Continuation) or MSS (Reversal) logic.
Volume Confirmation: For Order Blocks, it looks back inside the swing leg to find the specific candle responsible for the move, verifying it has significant volume.
💡 Note:
For the best experience, start in Phase 1 to calibrate your Swing Detection Length to the specific volatility of the asset you are trading before enabling Full Strategy Mode.
在腳本中搜尋"smart money"

BTC - VDD Multiple (Approx)Overview & Philosophy
⚠️ Note: This indicator is optimized for the Daily (1D) Timeframe. Please switch your chart to 1D for accurate signal reading.
The BTC – VDD Multiple (Approx) is an advanced oscillator designed to identify market overheating and cycle tops by analyzing the velocity of value moving through the market.
In traditional On-Chain Analysis, Value Days Destroyed (VDD) is a premier metric for spotting macro tops. It multiplies the coin age (how long a coin was held) by the price at which it was moved. When old coins (HODLer money) move at high prices, VDD spikes, signaling massive profit-taking.
The Problem: Real "Coin Days Destroyed" (CDD) data is typically locked behind institutional paywalls or unavailable on standard TradingView plans.
The Solution: This script calculates a Deterministic Proxy. By analyzing the relationship between Exchange Volume, Price, and a Dormancy Constant, we can approximate the structure of the VDD Multiple without needing a premium data feed.
Methodology
The VDD Multiple works by comparing short-term market velocity against a long-term baseline.
1. The Proxy Calculation
Since we cannot directly access the age of coins on TradingView, we model the economic weight of the move:
Proxy Value = Exchange Volume * Price * Dormancy Factor
This creates a synthetic representation of "Value Throughput."
2. The Multiple
We compare the immediate heat of the market against the yearly trend:
• Short-Term MA (2 Days): Captures flash spikes and sudden liquidity exit events.
• Long-Term MA (365 Days): Represents the baseline "hum" of network activity.
VDD Multiple = Short Term MA / Long Term MA
How to Read the Chart
The indicator plots the Multiple as a line and uses background highlighting to signal extreme regimes.
🔴 The Red Zone (Overheated > 2.9)
Meaning: Current value transfer is ~3x higher than the yearly average.
Interpretation: Historically, sharp spikes into the Red Zone correlate with Local or Cycle Tops. This indicates that massive volume is changing hands at high prices—typically a sign of "Smart Money" distributing into "Dumb Money" FOMO.
Note: In strong bull runs, price can push higher even after a VDD spike, but the risk/reward ratio is extremely poor here.
🟢 The Green Zone (Undervalued < 0.75)
Meaning: Market activity is quiet and below the yearly baseline.
Interpretation: These are periods of apathy or accumulation. Historically, extended time spent in the Green Zone (the "flatline") has offered the best asymmetric buying opportunities.
🟠 The Orange Line (Neutral)
Meaning: The market is in transition or equilibrium.
Strategy & Context
This indicator is best used as a Macro Cycle Tool, not a day-trading signal.
• Exit Strategy: Look for "Clusters" of Red Spikes. A single spike often marks a local correction, but a cluster of intense spikes while price makes new highs (Divergence) is a strong Cycle Top warning.
• Entry Strategy: Historically the best entries occur when the indicator flattens out in the Green Zone for weeks or months. This suggests sellers are exhausted and the market has reached a floor.
Credits
This script is an approximation of the original VDD Multiple concept. Full credit for the underlying on-chain theory goes to the pioneers of this metric:
• Concept: The original Value Days Destroyed metric was popularized by Hans Hauge and Glassnode.
• The Multiple: The specific application of a Short/Long MA Multiple on VDD is widely attributed to analysts like TXMC and Bitbo.
This script adapts these concepts for the free TradingView environment using exchange volume proxies.
Settings
• Data Source: Defaults to BINANCE:BTCUSDT to capture high-volume liquidity.
• Short MA: Default is 2 Days to capture rapid velocity spikes.
• Long MA: Default is 365 Days to track the annual trend.
Disclaimer
This tool is an approximation based on exchange volume, not raw blockchain data. While exchange volume and on-chain volume are highly correlated during cycle extremes, they are not identical. This script is for educational and research purposes only. Past performance does not guarantee future results.
Tags
bitcoin, btc, onchain, vdd, cdd, valuation, cycle, top, bottom, Rob Maths

BTC - ALSI: Altcoin Season Index (Dynamic Eras)Title: BTC - ALSI: Altcoin Season Index (Dynamic Eras)
Overview & Philosophy
The Altcoin Season Index (ALSI) is a quantitative tool designed to answer the most critical question in crypto capital rotation: "Is it time to hold Bitcoin, or is it time to take risks on Altcoins?"
Most "Altseason" indicators suffer from Survivor Bias or Obsolescence. They either track a static list of coins that includes "dead" assets from previous cycles (ghosts of 2017), or they break completely when major tokens collapse (like LUNA or FTT).
This indicator solves this by using a Time-Varying Basket. The indicator automatically adjusts its reference list of Top 20 coins based on historical eras. This ensures the index tracks the winners of the moment—capturing the DeFi summer of 2020, the NFT craze of 2021, and the AI/Meme narratives of 2024/2025.
Methodology
The indicator calculates the percentage of the Top 20 Altcoins that are outperforming Bitcoin over a rolling window (Default: 90 Days).
The "Win" Count: For every major Altcoin performing better than BTC, the index adds a point.
Dynamic Eras: The basket of coins changes depending on the date:
2020 Era (DeFi Summer): Tracks the "Blue Chips" of the DeFi revolution like UNI, LINK, DOT, and early movers like VET and FIL.
2021 Era (Layer 1 Wars): Tracks the explosion of alternative smart contract platforms, adding winners like SOL, AVAX, MATIC, and ALGO.
2022 Era (The Survivors): Filters for resilience during the Bear Market, solidifying the status of established assets like SHIB and ATOM.
2023 Era (Infrastructure & Scale): Captures the rise of "Next-Gen" tech leading into the pre-halving year, introducing TON, APT (Aptos), and ARB (Arbitrum).
2024/25 Era (AI & Speed): Tracks the current Super-Cycle leaders, focusing on the AI narrative (TAO, RNDR), High-Performance L1s (SUI), and modern Memes (PEPE).
Chart Analysis & Strategy ( The "Alpha" )
As seen in the chart above, there is a strong correlation between ALSI Peaks and local tops in TOTAL3 (The Crypto Market Cap excluding BTC & ETH).
The Entry (Rotation): When the indicator rises above the neutral 50 line, it signals that capital is beginning to rotate out of Bitcoin and into Altcoins. This has historically been a strong confirmation signal to increase exposure to high-beta assets.
The Exit (Saturation): When the indicator hits 100 (or sustains in the Red Zone > 75), it means every single Altcoin is beating Bitcoin. Historically, this extreme exuberance often marks a local top in the TOTAL3 chart. This is the zone where smart money typically sells into strength, rather than opening new positions.
How to Read the Visuals
🚀 Altcoin Season (Red Zone > 75): Strong Altcoin dominance. The market is "Risk On."
🛡️ Bitcoin Season (Blue Zone < 25): Bitcoin dominance. Alts are bleeding against BTC. Historically, this is a defensive zone to hold BTC or Stablecoins.
Data Dashboard: A status table in the bottom-right corner displays the live Index Value, current Regime, and a System Check to ensure all 20 data feeds are active.
Settings
Lookback Period: Default 90 Days. Lowering this (e.g., to 30) makes the index faster but noisier.
Thresholds: Adjustable zones for Altcoin Season (Default: 75) and Bitcoin Season (Default: 25).
Credits & Attribution
This open-source indicator is built on the shoulders of giants. I acknowledge the original creators of the concept and the pioneers of its implementation on TradingView:
Original Concept: BlockchainCenter.net. - They established the industry standard definition: 75% of the Top 50 coins outperforming Bitcoin over 90 days = Altseason..
TradingView Implementation: Adam_Nguyen - He implemented the "Dynamic Era" logic (updating the coin list annually) on TradingView. Our code structure for the time-based switching is inspired by his methodology. See also his implementation in the chart. ( Altcoin Season Index - Adam) .
Comparison: Why use ALSI | RM?
While inspired by the above, ALSI introduces three key improvements:
Open Source: Unlike other popular TradingView versions (which are closed-source), this script is fully transparent. You can see exactly which coins are triggering the signal.
Sanitized History (Anti-Fragile): Historical Top 20 snapshots are not blindly used. "Dead" coins (like LUNA and FTT) from previous eras are manually filtered out. A raw index would crash during the Terra/FTX collapses, giving a false "Bitcoin Season" signal purely due to bad actors. The curated list preserves the integrity of the market structure signal.
Narrative Relevance: The 2024/25 basket was updated to include TAO (Bittensor) and RNDR, ensuring the index captures the dominant AI narrative, rather than tracking fading assets from the previous cycle.
You can compare the ALSI indicator with other available tradingview indicators in the chart: Different indicators for the same idea are shown in the 3 Pane window below the BTC and Total3 chart, whereas ALSI is the top pane indicator.
Important Note on Coin Selection Baskets are highly curated: Dead/irrelevant coins (FTT, LUNA, BSV) are excluded for clean signals. This prevents historical breaks and ensures Era T5 captures current narratives (AI, Memes) via TAO/RNDR. See above. Users are free to adjust the source code to test their own baskets.
Disclaimer
This script is for research and educational purposes only. Past correlations between ALSI and TOTAL3 do not guarantee future results. Market regimes can change, and "Altseasons" can be cut short by macro events.
Tags
bitcoin, btc, altseason, dominance, total3, rotation, cycle, index, alsi, Rob Maths

Advanced Breakout System v2.0Advanced Breakout System v2.0
Developed by: Mohammed Bedaiwi
This script hunts for high-probability breakouts by combining price consolidation zones, volume spikes vs. average volume, smart money flow (OBV), and a Momentum Override for explosive moves that skip consolidation. Additionally, it automatically identifies and plots Support and Resistance levels with price labels to help you visualize market structure.
The system follows a "Watch & Confirm" logic: it first prints a WATCH setup, then a BUY only if price confirms strength.
💡 JUSTIFICATION OF CONCEPTS (MASHUP & ORIGINALITY)
This script is an original mashup combining several analytical concepts to address common breakout failures:
Volatility Compression Engine: Uses built-in functions like ta.highest() and ta.lowest() to mathematically define the setup phase where price volatility is compressed below a user-defined threshold.
Volume Spike Confirmation: The breakout must be confirmed by a volume increase greater than a moving average of volume, signaling strong market interest.
Smart Volume Filter (OBV): This is the key component. By checking if ta.obv is above its own Moving Average, we confirm that accumulation has been occurring during the consolidation period, suggesting institutional positioning before the price break.
Multi-Exit Risk System: Employs dynamic exits (EMA cross, volume dump, bearish pattern) instead of static stop-losses to manage risk adaptively based on real-time market action.
Market Structure Visualization: The script also includes a Support & Resistance engine to plot key swing pivots and price labels for visual context.
✅ STRATEGY RESULTS & POLICY COMPLIANCE
To ensure non-misleading and transparent backtesting results, this strategy is published with the following fully compliant properties:
Dataset Compliance: The backtest is performed on the CMTL Daily (1D) chart across a long history, generating 201 total trades. This significantly exceeds the minimum requirement of 100 trades, providing a robust test dataset.
Risk Control: The strategy uses a conservative order size set to 2% of equity (default_qty_value=2), strictly adhering to the sustainable risk recommendation of 5-10% of equity per trade.
Transaction Costs: Realistic trading conditions are modeled using 0.07% commission and 3 ticks slippage to prevent the overestimation of profitability.
⚙️ VISUAL GUIDE & SIGNAL LOGIC
Key Color Legend (Visual Guide):
WATCH – Setup (Yellow Arrow Down): Potential breakout setup detected.
BUY – Confirmation (Green Arrow Up): Confirmed breakout, triggered when price trades above the high of the WATCH candle.
SELL – Break (Orange Arrow): Short-term trend weakness, triggered when price closes below the Fast EMA (9).
SELL – Dump (Dark Red Arrow): Distribution / volume dump, triggered by a bearish candle with abnormally high volume.
SELL – Pattern (Purple Arrow): Bearish price-action pattern (such as a bearish engulfing).
Support & Resistance Lines (Red/Green): Small horizontal lines plotted at key swing points with exact price labels.
⌨️ INPUTS (DEFAULT SETTINGS)
Entry settings: Consolidation Lookback (default 20) = bars used to detect consolidation. Consolidation Range % (default 12%) = max allowed range size. Volume Spike Multiplier (default 1.2) = factor above average volume to count as a spike. Force Signal on Big Moves (default ON) = forces a WATCH signal on high-momentum moves.
Exit settings: Enable Fast Exit (EMA 9) toggles the SELL – Break signal. Dump Volume Multiplier defines what counts as “dump” volume.
Support & Resistance: Adjustable Pivot Left/Right bars control the sensitivity of the support and resistance lines.
⚠️ Disclaimer Trading involves significant risk of loss. This script is for educational and informational purposes only and is not financial advice or a recommendation to buy or sell any asset. BUY and SELL signals are rule-based and derived from historical behavior and do not guarantee future performance. Always use your own analysis and risk management. This is an open-source strategy; users are encouraged to test it across different symbols and timeframes.

Bayesian Liquidity Pain & Gain [Instit. Vol Weighted]Bayesian Liquidity Pain & Gain Indicator
Stop guessing where support and resistance are.
The Bayesian Liquidity Pain & Gain indicator moves beyond arbitrary lines and raw price action. It quantifies Institutional Intent by calculating the exact price levels where large volume has been accumulated and visualizes the "Pain" (stress) those participants feel when the market moves against them.
The Logic: Quantified Institutional Stress
Institutions don't trade single candles; they accumulate positions over time. This indicator tracks their Volume-Weighted Average Cost Basis to answer two critical questions:
Where did they enter? (The Cost Basis Lines)
Are they underwater? (The Pain Clouds)
By normalizing price distance using volatility (ATR) and statistical deviation (Z-Score), we filter out noise and only highlight zones where "Smart Money" is statistically forced to defend their positions or capitulate.
How to Read the Chart
1. The Cost Basis Lines (Anchors)
• 🟢 Green Line (Buyer Cost Basis): The average price where institutions accumulated long positions. This acts as dynamic Support.
• 🔴 Red Line (Seller Cost Basis): The average price where institutions accumulated short positions. This acts as dynamic Resistance.
2. The Pain Clouds (Signals)
When price moves significantly away from the cost basis (Z-Score > 2.0), "Clouds" appear to visualize the PnL status of the participants:
• 🔴 Red Cloud (Buyer Pain): Price is below the buyer's entry. Buyers are losing money (in the red). This creates a "Discount" zone where they may defend support.
• 🟢 Green Cloud (Seller Pain): Price is above the seller's entry. Sellers are losing money (shorts are squeezed). This indicates strong bullish momentum.
3. The Multi-Timeframe Dashboard
A real-time HUD showing the Z-Score status across 4 timeframes (1m, 5m, 15m, 1h):
• 🟢 Green: Profitable/Neutral (Trend Continuation)
• 🟠 Orange: Warning (Pressure Building)
• 🔴 Red: Critical Pain (High Probability Reversal)
Trading Strategies
Setup 1: The Defensive Bounce (Long)
• Context: Price drops into a 🔴 Red Cloud (Buyer Pain).
• Trigger: Price touches the 🟢 Green Line (Buyer Cost Basis) and shows a rejection wick.
• Logic: Institutional buyers defend their cost basis to avoid realizing losses.
Setup 2: The Short Squeeze (Momentum)
• Context: Price rallies into a 🟢 Green Cloud (Seller Pain).
• Trigger: Price holds above the 🔴 Red Line (Seller Cost Basis).
• Logic: Short sellers are trapped and forced to buy back (cover), fueling the rally.
Fractal Alignment:
For high-conviction trades, wait for the Dashboard to show "Pain" signals on both the 1h (Anchor) and 5m (Trigger) timeframes simultaneously.
Settings
• Memory Length (Default 144): The lookback period for the institutional cost basis. Increase for swing trading, decrease for scalping.
• Sigma Threshold (Default 2.0): The statistical confidence level for "Pain". Higher values = fewer, stronger signals.
• Volume Amp: When enabled, high volume amplifies the pain signal, giving more weight to institutional footprints.

LiqVision Institutional Suite v6.2 – Hybrid ModeLiqVision Institutional Suite v6.2 — Hybrid Mode (Lightning Edition)
Een ultra-geoptimaliseerde Smart Money-indicator gebaseerd op institutionele principes: Liquidity, Market Structure, Order Blocks, FVG’s en Model 1/2 setups.
Dit script combineert meerdere professionele SMC-concepten in één engine:
🔷 Functionaliteiten
1. Liquidity Engine
Automatische detectie van EQH, EQL en Liquidity Sweeps
Dynamische lijnprojectie met smart cleanup
Slimme sweep-detectie voor high-probability entries
2. Market Structure Engine
BOS & CHOCH detectie
Trend continuatie- en reversalsignalen
Swing-based pivot logic
3. Order Block Engine
Automatische OB-detectie met displacement filtering
Bullish & Bearish macro Order Blocks
HTF glow overlay (nieuw in v6.2)
4. FVG Engine
Major Fair Value Gap detection
Up/Down imbalance visual engine
HTF-based color restoration (v6.2 fix)
5. Model 1 & Model 2 Signal Engine
Trend continuation entries (Model 1)
Reversal setups gebaseerd op HTF liquidity & displacement (Model 2)
Auto-tapping logic geïntegreerd met OB/FVG
6. Hybrid Mode Rendering
Slimme shading afhankelijk van timeframe:
LTF → Hide OB/FVG
MTF → White overlays
HTF → Premium glow visuals
🔷 Alerts
Volledige alert-ondersteuning voor:
Model 1 Buy/Sell
Model 2 Buy/Sell
Liquidity Sweep
BOS Up/Down
CHOCH Up/Down
OB Tap
FVG Tap
Any alert() function call
Geschikt voor Telegram, Discord, bots en externe signal pipelines.
🔷 Gebruik
Voeg de indicator toe
Kies timeframe (1m–4h aanbevolen)
Activeer alerts via “Any alert() function call”
Volg Model 1/2 entries voor optimaal resultaat
⚡ DISCLAIMER
Dit script is uitsluitend bedoeld voor educatieve doeleinden. Geen financieel advies. Resultaten uit het verleden geven geen garantie voor de toekomst.

Equal Highs/Lows Multi-Pivot [Julio]Equal Highs/Lows Multi-Pivot
Description
A sophisticated multi-timeframe pivot analysis tool that detects and highlights equal highs and equal lows across four different pivot lengths simultaneously. This indicator identifies price levels where the market creates identical extremes, a powerful signal of institutional support/resistance and potential reversal or breakout zones.
How It Works
Four Independent Pivot Streams
Pivot 1 (Intraday - 2 bars): Ultra-fast level detection for scalpers
Pivot 2 (Session - 4 bars): Short-term swing levels
Pivot 3 (Daily - 6 bars): Medium-term structural levels
Pivot 4 (Weekly - 9 bars): Long-term institutional levels
Equal High (EQH) Detection
Compares consecutive swing highs and draws a line when two highs are nearly identical within a defined threshold. The indicator uses ATR-based confluence to determine "equality," filtering out noise while catching true market structure.
Equal Low (EQL) Detection
Same logic applied to swing lows, identifying support zones where price repeatedly fails to break below previous lows.
Key Features
Four Simultaneous Timeframes: Analyze intraday, session, daily, and weekly structures all on one chart
ATR-Based Confluence Threshold: Automatically adjusts sensitivity based on current volatility (no fake signals)
Color-Coded Levels: Each pivot length has distinct colors for instant visual identification
Highs: Red, Orange, Yellow, Fuchsia
Lows: Green, Blue, Aqua, Purple
Confirmation Mode: Optional setting to wait for full pivot confirmation before marking levels
Customizable Alert Zones: Toggle individual pivot lengths on/off to reduce clutter
Smart Label Positioning: Labels auto-center between the two equal pivots for clarity
Ideal For
Swing traders tracking support/resistance across multiple timeframes
Scalpers identifying micro-structure for quick entries and exits
Market structure analysts studying institutional price action patterns
Multi-timeframe traders needing confluence from intraday to weekly levels
Anyone trading 1-minute to 4-hour charts
Trading Applications
Identify strong support/resistance zones: Equal levels = confirmed institutional levels
Confirm trend reversals: Multiple equal lows = strong accumulation zone; multiple equal highs = distribution
Plan entries with precision: Enter near equal levels for higher probability setups
Detect liquidity concentration: Where price repeatedly tests the same level
Multi-timeframe confluence: Look for equal levels across multiple pivot lengths for ultra-strong zones
How to Use
Identify the equal levels: Color-coded lines instantly show where price creates matching extremes
Check for confluence: Strong setups occur where multiple pivot lengths align
Wait for price action: Watch for breakouts through equal levels or reversals at these zones
Enter with structure: Use equal levels as entry/exit triggers combined with your trading methodology
Manage with confidence: These levels mark institutional decision points
Customization Options
Adjust pivot lengths to match your preferred timeframe structure
Set ATR threshold sensitivity (lower = stricter equality, higher = more signals)
Toggle confirmation mode for additional filter
Enable/disable individual pivot streams to reduce visual clutter
Customize colors to match your chart theme
Default Settings Optimized For
NASDAQ futures and liquid forex pairs
Intraday and swing trading (1-minute to 4-hour charts)
Smart Money / ICT trading methodologies
Volatility-adjusted confluence detection

DANCE WITH WOLVES VN ALL TO 1DANCE WITH WOLVES VN is a smart-money volume indicator designed for stocks and crypto.
Main features:
• logic to detect Distribution, No Demand, Absorption and Exhaustion.
• Automatically builds smart Support/Resistance zones from high-volume price leaders.
• Regression trend channel to see the short-term trend and trading range.
• Dashboard table that shows the top high/low price bars with buy/sell volume and group labels.
• Alert conditions for Breakout above resistance and At Support Area so you don’t need to watch the chart all the time.
You can use it on any symbol and timeframe. Just add the script to your chart and follow the zones (red = resistance, green = support) together with the P/L labels and the status line.
Vietnamese note: Indicator dùng volume + để vẽ vùng hỗ trợ/kháng cự thông minh, label phân phối / hấp thụ / cạn lực bán và kênh xu hướng. Dùng được cho cả stock và crypto. tot nhat dung khung 5 den 15 phut

Cumulative Volume Delta (HA Option)# **📘 Ultimate Guide to Trading With CVD Heikin Ashi (CVD+)**
## **🔍 What This Indicator Shows**
This tool plots **Cumulative Volume Delta (CVD)** as candlesticks—optionally transformed into **Heikin Ashi CVD candles**.
Instead of price, each candle represents the *battle between buyers and sellers* within your chosen timeframe.
**Volume Delta = Buying Volume – Selling Volume**
CVD takes all deltas and stacks them cumulatively, showing who is controlling the auction *over time*.
With Heikin Ashi smoothing layered on top, trend detection becomes cleaner, letting you see the “true pressure” behind price moves.
---
# **💡 Why CVD Is a Game Changer**
Most traders only see price.
Serious traders watch **pressure**.
CVD exposes what price hides:
* Absorption
* Hidden accumulation
* Seller exhaustion
* Fake breakouts
* True reversals
* Momentum strength / weakness
* Smart money footprint
When combined with Heikin-Ashi smoothing, you get delta trends with way less noise and fewer fake flips.
---
# **📈 How to Actually Use It (The Edge)**
## **1. Spot True Trend vs. Fake Trend**
If **price goes up** but **CVD goes down**, that’s:
* Passive sellers absorbing
* A weak rally
* High probability of reversal
If **price pulls back** but **CVD keeps rising**, that’s:
* Secret accumulation
* A continuation setup
* Great dip-buy opportunity
**Rule of thumb:**
🔹 *Follow the CVD trend, not the price noise.*
---
## **2. Catch Reversals Early**
Watch for:
### **🔻 Bearish Reversal Signals**
* CVD makes a **lower high**
* Heikin Ashi CVD prints **red bodies with rising upper shadows**
* Price makes one final push up on low delta
This is classic distribution → the drop usually follows fast.
### **🔹 Bullish Reversal Signals**
* CVD forms a **higher low**
* HA CVD flips from red to green with full bodies
* Price still looks weak = bottom forming
This is exactly how pros catch bottoms early.
---
## **3. Identify Absorption Levels**
If price hits a level multiple times but CVD keeps climbing (or falling), that level is being defended.
Example:
* Price stalls at support
* CVD keeps rising
= **Buyers absorbing sells → high-probability bounce**
Opposite works for resistance.
---
## **4. Validate Breakouts**
A breakout with *weak or negative CVD* is usually a trap.
A breakout with **strong, rising HA CVD** is real.
If CVD diverges from the breakout direction → fade it.
If CVD confirms → ride it.
---
## **5. Use Heikin Ashi to Stay in Trends**
HA smoothing removes the nasty chop of raw delta data.
Look for:
* Consecutive **full-body teal candles = strong buying wave**
* Consecutive **full-body red candles = strong selling wave**
* Small-bodied candles after a trend = momentum dying
This keeps you in winners longer and cuts losers faster.
---
# **🎯 Practical Trading Playbook**
### **A) Long Setup**
1. Price pullback into support
2. CVD stays bullish or makes a higher low
3. HA CVD flips green or prints a strong body
4. Enter long
5. Stop under CVD structural low
### **B) Short Setup**
1. Price pushes into resistance
2. CVD forms bearish divergence
3. HA CVD prints red bodies
4. Enter short
5. Stop above CVD swing high
### **C) Chop Filter**
No clear HA CVD trend = avoid trading → stop donating money to the market.
---
# **🧠 Tips for Mastery**
* Use lower timeframe delta (1m–5m) for scalping entries
* Use a higher anchor timeframe (1D) to define direction
* When price trends but CVD is flat → expect a fakeout
* When CVD trends but price is flat → expect a breakout
* Trade WITH delta, fade AGAINST delta
---
# **⚠️ Important Notes**
* Crypto = full tick-by-tick volume → CVD is extremely accurate
* Stocks = depends on your broker/data vendor
* Futures = best signal-to-noise ratio
* If your symbol has no volume → indicator will warn you
---
# **📥 Recommended Settings**
* **Anchor timeframe**: 1D or 4H
* **Lower timeframe**: 1m, 3m, or 5m
* **Heikin Ashi**: ON for trend filtering, OFF for raw delta
---
# **🔥 Final Word**
Price can lie.
Delta usually doesn’t.
CVD + Heikin Ashi gives you the closest thing to reading the market’s heartbeat in real time.
Use it to confirm breakouts, detect reversals early, identify real trend strength, and avoid getting caught in manipulation.
If you learn to read CVD well…
you stop trading price, and start trading the **intent** behind the price.

Dynamic Liquidity Levels [CDC Trading LABN] (ENGLISH)Script Description :
Take your market structure and liquidity analysis to the next level with Dynamic Liquidity Levels, a professional-grade tool designed to visualize the key levels that truly move the price. This indicator doesn't just plot static lines; it offers a dynamic framework that reacts to price action in real-time, keeping your chart clean and focused on what matters.
Designed for scalpers and swing traders alike, this indicator is your map for navigating market liquidity.
Key Features
• Smart Dynamic Lines: The standout feature of this indicator. Lines automatically stop extending once price has "invalidated" them. You decide whether the break occurs on a simple wick touch (to capture liquidity grabs) or a full candle close beyond the level (for a stronger confirmation).
• Comprehensive Liquidity Levels: Automatically draws the most important liquidity pools that professional traders watch every day:
• HTF Levels: Previous Day, Week, and Month Highs & Lows (PDH/L, PWH/L, PMH/L).
• Session Levels: Asian, London, and New York Session Highs & Lows (ASH/L, LSH/L, NYH/L).
• Full Label Control: Forget about overlapping labels. Adjust the position of each label individually (Left, Right, Center, Upper, Lower) for perfect visual clarity in any market condition.
• Instant, Configurable Alerts: Never miss an opportunity. Set up alerts that trigger the moment a level of your choice is broken, helping you execute your trades with precision.
• Clean & Professional Visualization: Fully customizable. Adjust colors, line width, and decide whether to display exact prices in the labels for an analysis setup tailored to your style.
Who is This Indicator For?
This tool is essential for a wide range of trading methodologies:
• Smart Money Concepts (SMC) & ICT Traders: Perfect for identifying liquidity pools and draw on liquidity levels. Use it to frame your order blocks and points of interest.
• Candle Range Theory (CRT) Traders: This indicator automates the core of your analysis. It identifies and projects the key candle ranges from higher timeframes (Daily, Weekly, Monthly) and trading sessions. Use these levels to anticipate price expansion and identify liquidity targets above and below established ranges, without manual markup every day.
• Price Action Traders: Clearly and automatically visualize the most relevant support and resistance levels based on high-timeframe market structure.
• Day Traders & Scalpers: Make quick decisions based on previous day's levels and session highs/lows, which act as magnets for intraday price.
• Swing Traders: Use the weekly and monthly levels to get a macro view of the structure and plan longer-term trades.
How to Use
1. Add the indicator to your chart.
2. Explore the settings panel to enable the levels and alerts that fit your trading plan.
3. Adjust the label positions for maximum clarity.
4. To receive alerts, right-click on the chart, create a new alert, select the indicator from the dropdown, and choose the "Any alert() function call" option.
We hope this tool greatly helps you improve your market analysis.
Happy trading!
CDC Trading LABN

Dynamic Liquidity Levels [CDC Trading LABN] (ESPAÑOL)Script Description :
Take your market structure and liquidity analysis to the next level with Dynamic Liquidity Levels , a professional-grade tool designed to visualize the key levels that truly move the price. This indicator doesn't just plot static lines; it offers a dynamic framework that reacts to price action in real-time, keeping your chart clean and focused on what matters.
Designed for scalpers and swing traders alike, this indicator is your map for navigating market liquidity.
Key Features
• Smart Dynamic Lines: The standout feature of this indicator. Lines automatically stop extending once price has "invalidated" them. You decide whether the break occurs on a simple wick touch (to capture liquidity grabs) or a full candle close beyond the level (for a stronger confirmation).
• Comprehensive Liquidity Levels: Automatically draws the most important liquidity pools that professional traders watch every day:
• HTF Levels: Previous Day, Week, and Month Highs & Lows (PDH/L, PWH/L, PMH/L).
• Session Levels: Asian, London, and New York Session Highs & Lows (ASH/L, LSH/L, NYH/L).
• Full Label Control: Forget about overlapping labels. Adjust the position of each label individually (Left, Right, Center, Upper, Lower) for perfect visual clarity in any market condition.
• Instant, Configurable Alerts: Never miss an opportunity. Set up alerts that trigger the moment a level of your choice is broken, helping you execute your trades with precision.
• Clean & Professional Visualization: Fully customizable. Adjust colors, line width, and decide whether to display exact prices in the labels for an analysis setup tailored to your style.
Who is This Indicator For?
This tool is essential for a wide range of trading methodologies:
• Smart Money Concepts (SMC) & ICT Traders: Perfect for identifying liquidity pools and draw on liquidity levels. Use it to frame your order blocks and points of interest.
• Candle Range Theory (CRT) Traders: This indicator automates the core of your analysis. It identifies and projects the key candle ranges from higher timeframes (Daily, Weekly, Monthly) and trading sessions. Use these levels to anticipate price expansion and identify liquidity targets above and below established ranges, without manual markup every day.
• Price Action Traders: Clearly and automatically visualize the most relevant support and resistance levels based on high-timeframe market structure.
• Day Traders & Scalpers: Make quick decisions based on previous day's levels and session highs/lows, which act as magnets for intraday price.
• Swing Traders: Use the weekly and monthly levels to get a macro view of the structure and plan longer-term trades.
How to Use
1. Add the indicator to your chart.
2. Explore the settings panel to enable the levels and alerts that fit your trading plan.
3. Adjust the label positions for maximum clarity.
4. To receive alerts, right-click on the chart, create a new alert, select the indicator from the dropdown, and choose the "Any alert() function call" option.
We hope this tool greatly helps you improve your market analysis.
Happy trading!
CDC Trading LABN

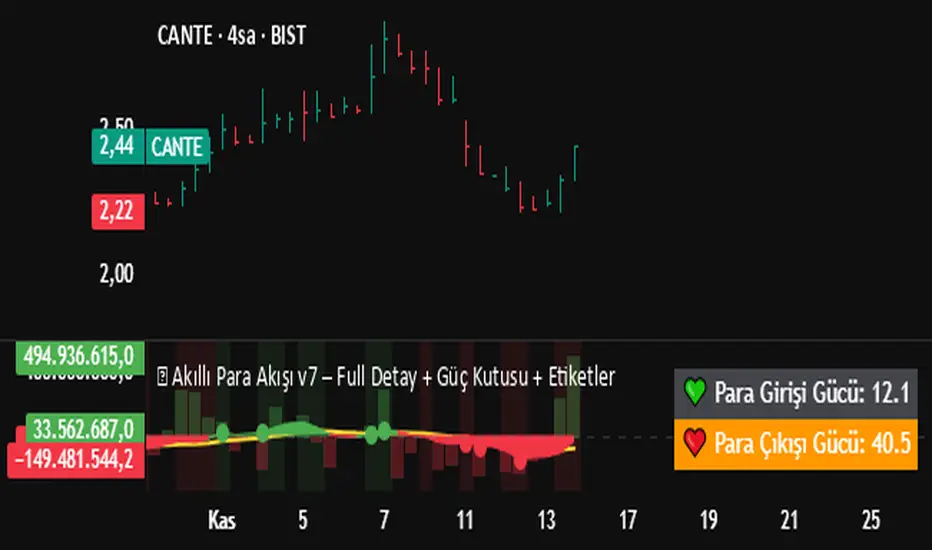
💰 Akıllı Para Akışı v7 – Full Detay + Güç Kutusu + Etiketler✅ Everything Included:
✔ Money Flow
✔ RSI (Relative Strength Index)
✔ Momentum Filter
✔ Price Change Analysis
✔ Smart Money Zone Detection
✔ Strength Score (0–100)
✔ Dual Power Box (Inflow/Outflow Strength)
✔ Full-Detail BUY/SELL Labels
✔ Alert System (BUY & SELL)
✔ Optimized for Bottom Panel Display
Liquidity Swap Detector Ultimate - Cedric JeanjeanAdvanced Smart Money Concepts indicator designed to detect high-probability liquidity sweeps and institutional order flow reversals. This professional-grade tool combines multiple ICT (Inner Circle Trader) strategies to identify optimal entry points.
═══════════════════════════════════════════════════════
📊 KEY FEATURES:
✅ Smart Swing Detection
- Identifies confirmed swing highs and lows using adaptive lookback periods
- Eliminates false signals through double-confirmation logic
- Detects liquidity grabs at key market structure points
✅ Fair Value Gap (FVG) Analysis
- Multi-timeframe FVG detection for enhanced accuracy
- Filters imbalances by minimum size threshold
- Combines current timeframe and higher timeframe FVGs
✅ Advanced Volatility Filter
- ATR-based volatility analysis to avoid low-quality setups
- Adjustable volatility threshold (default 0.35%)
- Ensures entries during optimal market conditions
✅ Precision Signal Generation
- LONG signals: Confirmed swing lows + FVG + volatility confirmation
- SHORT signals: Confirmed swing highs + FVG + volatility confirmation
- Clear visual markers with price labels
✅ Comprehensive Alert System
- Three alert types: Simple, Detailed, JSON (for webhooks)
- Separate LONG/SHORT alert controls
- Compatible with MT5 integration via webhooks
- TradingView native alertcondition support
✅ Professional Dashboard
- Real-time ATR monitoring
- Volatility percentage display
- FVG status indicator
- Alert status tracker
═══════════════════════════════════════════════════════
⚙️ CUSTOMIZABLE PARAMETERS:
🔹 Lookback Swing (1-50): Defines swing detection sensitivity
🔹 ATR Multiplier: Controls wick filter strength
🔹 Volatility Filter: Minimum required market volatility (%)
🔹 FVG Filter: Minimum fair value gap size (%)
🔹 FVG Timeframe: Higher timeframe for multi-TF analysis
🔹 Visual Options: Toggle swing marks, FVG zones, labels
🔹 Alert Controls: Enable/disable LONG/SHORT notifications
═══════════════════════════════════════════════════════
📈 HOW IT WORKS:
1. The indicator scans for confirmed swing points using a robust double-confirmation algorithm
2. Simultaneously analyzes Fair Value Gaps on both current and higher timeframes
3. Validates market volatility to ensure sufficient price movement
4. Generates precise entry signals when all conditions align
5. Triggers customizable alerts for instant notification
═══════════════════════════════════════════════════════
🎯 BEST PRACTICES:
- Use on liquid markets (Forex majors, indices, crypto)
- Recommended timeframes: 15m, 1H, 4H
- Combine with support/resistance for confirmation
- Adjust lookback period based on market volatility
- Test alert settings before live trading
- Use JSON alerts for automated trading integration
═══════════════════════════════════════════════════════
⚡ ALERT CONFIGURATION:
1. Click the Alert icon (bell) in TradingView
2. Select "Liquidity Swap Detector Ultimate - TITAN v6"
3. Choose your preferred alert condition:
- LONG Signal: Only bullish setups
- SHORT Signal: Only bearish setups
- ANY Signal: All trading opportunities
4. Set expiration and notification preferences
5. For MT5 integration: Select "JSON" message type and configure webhook URL

ICT HTF Volume Candles (Based on HTF Candles by Fadi)# ICT HTF Volume Candles - Multi-Timeframe Volume Analysis
## Overview
This indicator provides multi-timeframe volume visualization designed to complement price action analysis. It displays volume data from up to 6 higher timeframes simultaneously in a separate panel, allowing traders to identify volume spikes, divergences, and institutional activity without switching between timeframes.
**Original Concept Credits:** This indicator builds upon the HTF Candles framework by Fadi, adapting it specifically for volume analysis with enhanced features including gap-filling for extended hours, multiple scaling methods, and advanced synchronization.
## What Makes This Script Original
### Key Innovations:
1. **Three Volume Scaling Methods:**
- **Per-HTF Auto Scale:** Each timeframe scales independently for detailed comparison
- **Global Auto Scale:** All timeframes use unified scale for relative volume comparison
- **Manual Scale:** User-defined maximum for consistent analysis across sessions
2. **Bullish/Bearish Volume Differentiation:**
- Volume bars colored based on price movement (close vs open)
- Separate styling for bullish (green) and bearish (red) volume periods
- Helps identify whether volume supports price direction
3. **Advanced Time Synchronization:**
- Custom daily candle open times (Midnight, 8:30 AM, 9:30 AM ET)
- Timezone-aware calculations for New York trading hours
- Real-time countdown timers for each timeframe
- **Gap-filling technology** for continuous display during extended hours and weekends
4. **Flexible Display Options:**
- Configurable spacing and positioning
- Label placement (top, bottom, or both)
- Day-of-week or time interval labels on candles
- Works reliably in backtesting and live trading
## How It Works
### Volume Calculation
The indicator uses `request.security()` with optimized parameters to fetch volume data from higher timeframes:
- **Volume Open/High/Low/Close (OHLC):** Tracks volume changes within each HTF candle
- **Color Logic:** Compares HTF close vs open prices to determine bullish/bearish classification
- **Alignment:** All volume bars share a common baseline for easy visual comparison
- **Gap Handling:** Uses `gaps=barmerge.gaps_off` to maintain continuity during non-trading hours
### Technical Implementation
```
1. Monitors HTF timeframe changes using request.security() with lookahead
2. Creates new VolumeCandle object when HTF bar opens
3. Updates current candle's volume H/L/C on each chart bar
4. Applies selected scaling method to normalize display height
5. Repositions all candles and labels on each bar update
6. Fills gaps automatically during extended hours for consistent display
```
### Scaling Methods Explained
**Method 1 - Auto Scale per HTF:**
Each timeframe displays volume relative to its own maximum. Best for identifying patterns within each individual timeframe.
**Method 2 - Global Auto Scale:**
All timeframes share the same scale based on the highest volume across all HTFs. Best for comparing relative volume strength between timeframes.
**Method 3 - Manual Scale:**
User sets maximum volume value. Best for maintaining consistent scale across different trading sessions or instruments.
## How to Use This Indicator
### Setup
1. Add indicator to your chart (it appears in a separate panel below price)
2. Configure up to 6 higher timeframes (default: 5m, 15m, 1H, 4H, 1D, 1W)
3. Set number of candles to display for each timeframe
4. Choose volume scaling method based on your analysis needs
5. Enable "Fix gaps in non-trading hours" for extended hours trading (enabled by default)
### Interpretation
**Volume Spikes:**
- Sudden increase in volume height indicates institutional activity or strong conviction
- Compare volume between timeframes to identify where the real money is moving
- Look for volume spikes that appear across multiple timeframes simultaneously
**Bullish vs Bearish Volume:**
- **Green volume bars:** Price closed higher (buying pressure)
- **Red volume bars:** Price closed lower (selling pressure)
- High green volume during uptrend = confirmation of strength
- High red volume during downtrend = confirmation of weakness
- High volume opposite to trend = potential reversal warning
**Multi-Timeframe Context:**
- **5m/15m:** Scalping and day trading activity
- **1H/4H:** Swing trading and intraday institutional flows
- **Daily/Weekly:** Major position building and long-term trends
**Divergences:**
- Price making new highs but volume declining = weakening trend
- Volume increasing while price consolidates = potential breakout brewing
- Price breaks level but volume doesn't confirm = likely false breakout
### Practical Examples
**Example 1 - Institutional Confirmation:**
Price breaks above resistance. Check volume across timeframes:
- 5m shows spike = retail interest
- 15m + 1H + 4H all show spikes = institutional confirmation
- **Trade confidence: HIGH**
**Example 2 - False Breakout Detection:**
Price breaks resistance with:
- High volume on 5m only
- Normal/low volume on 1H and 4H
- **Interpretation:** Likely retail trap, institutions not participating
- **Action:** Wait for pullback or avoid
**Example 3 - Accumulation Phase:**
Price ranges sideways but:
- Daily volume gradually increasing
- Weekly volume above average
- **Interpretation:** Smart money accumulating
- **Action:** Prepare for breakout in direction of volume
**Example 4 - Volume Divergence:**
Price makes new high:
- Current high has lower volume than previous high across all timeframes
- **Interpretation:** Weakening momentum
- **Action:** Consider profit-taking or reversal trade
## Configuration Parameters
### Timeframe Settings
- **HTF 1-6:** Select timeframes (must be higher than chart timeframe)
- **Max Display:** Number of candles to show per timeframe (1-50)
- **Limit to Next HTFs:** Display only first N enabled timeframes (1-6)
### Styling
- **Bull/Bear Colors:** Separate colors for body, border, and wick
- **Padding from current candles:** Distance offset from live price action
- **Space between candles:** Gap between individual volume bars
- **Space between Higher Timeframes:** Gap between different timeframe groups
- **Candle Width:** Thickness of volume bars (1-4, multiplied by 2)
### Volume Settings
- **Volume Scale Method:** Choose 1, 2, or 3
- 1 = Auto Scale per HTF (each TF independent)
- 2 = Global Auto Scale (all TF unified)
- 3 = Manual Scale (user-defined max)
- **Auto Scale Volume:** Enable/disable automatic scaling
- **Manual Scale Max Volume:** Set maximum when using Method 3
### Label Settings
- **HTF Label:** Show/hide timeframe names with color and size options
- **Label Positions:** Display at Top, Bottom, or Both
- **Label Alignment:** Align centered or Follow Candles
- **Remaining Time:** Show countdown timer until next HTF candle
- **Interval Value:** Display day-of-week or time on each candle
### Custom Daily Candle
- **Enable Custom Daily:** Override default daily candle timing
- **Open Time Options:**
- **Midnight:** Standard 00:00 ET daily open
- **8:30 AM:** Align with economic data releases
- **9:30 AM:** Align with NYSE market open
- Useful for specific trading strategies or market alignment
### Advanced Settings
- **Fix gaps in non-trading hours:** Maintains alignment during extended hours and weekends (recommended: ON)
- Prevents visual gaps during forex weekend closures
- Ensures consistent display during crypto 24/7 trading
- Improves backtesting reliability
## Best Practices
1. **Pair with Price Action:** Use alongside HTF price candles indicator for complete picture
2. **Start Simple:** Enable 2-3 timeframes initially (e.g., 15m, 1H, 4H), add more as needed
3. **Match Settings:** Use same candle width/spacing as companion price indicator for visual alignment
4. **Scale Appropriately:**
- Use **Global scale** (Method 2) when comparing timeframes
- Use **Per-HTF scale** (Method 1) for pattern analysis within each timeframe
- Use **Manual scale** (Method 3) for consistent day-to-day comparison
5. **Watch for Volume Clusters:** High volume appearing simultaneously across multiple HTFs signals significant market events
6. **Confirm Breakouts:** Always check if volume supports the price movement across higher timeframes
7. **Extended Hours:** Keep "Fix gaps" enabled for 24/7 markets (Forex, Crypto) and weekend analysis
## Technical Notes
- **Timezone:** All calculations use America/New_York timezone for consistency
- **Real-time Updates:** Volume and timers update on each tick during market hours
- **Performance:** Optimized with max_bars_back=5000 for extensive historical analysis
- **Compatibility:** Works on all instruments with volume data (Stocks, Forex, Crypto, Futures)
- **Gap Handling:** Uses `barmerge.gaps_off` to fill data gaps during non-trading periods
- **Backtesting:** Uses `lookahead=barmerge.lookahead_on` for stable historical data without repainting
- **Data Continuity:** Automatically handles market closures, weekends, and extended hours
## Updates & Improvements
**Version 2.0 (Current):**
- ✅ Fixed alignment issues during extended hours and weekends
- ✅ Eliminated repainting in backtesting
- ✅ Added gap-filling technology for continuous display
- ✅ Improved data synchronization across all timeframes
- ✅ Enhanced NA value handling for data integrity
- ✅ Added advanced settings group for user control
## Support
For questions, suggestions, or feedback, please comment on the publication or message the author.
---
**Disclaimer:** This indicator is for educational and informational purposes only. It does not constitute financial advice. Past performance is not indicative of future results. Always perform your own analysis and implement proper risk management before making trading decisions.

Swing Points & Liquidity — ENHANCED PRO (Dark/Light Mode)This indicator — “Swing Points & Liquidity — ENHANCED PRO (Dark/Light Mode)” — automatically detects and visualizes swing highs, swing lows, and liquidity levels on the chart with rich analytics and customizable visuals.
🔍 Core Features
Smart Swing Detection: Identifies pivot highs/lows based on adjustable left/right bar settings.
Liquidity Visualization: Draws dynamic boxes and lines for liquidity pools and swing zones.
Volume & OI Integration: Filters and colors levels using volume and Open Interest Δ (change).
Strength Meter: Highlights strong liquidity levels with color gradients based on OI + volume intensity.
Automatic Trendlines: Connects swing points with selectable style and width.
Fibonacci Mapping: Automatically projects fib retracements (23.6%, 38.2%, 50%, 61.8%, 78.6%) from swing-to-swing for confluence zones.
Statistics Panel: Displays live metrics — total levels, active/filled count, success rate, and average strength.
Alerts System: Alerts for new swing formations and when price touches or breaks a level.
Multi-Timeframe Option: Analyze swing structures from higher timeframes on any chart.
Dual Theme Mode: Fully optimized for both Dark and Light interface preferences.
⚙️ Advanced Options
Adjustable lookback range
Hide or extend filled levels
Configurable volume and OI thresholds
Supports multiple OI data sources (Binance, BitMEX, Kraken)
Fully dynamic text, color, and label alignment settings
💡 Use Case
Perfect for Smart Money Concept (SMC) and ICT-style analysis, liquidity sweeps, and swing-based trading.
Traders can quickly visualize where liquidity sits, track how it gets filled, and monitor structure shifts in real time.

Volume Rate of Change (VROC)# Volume Rate of Change (VROC)
**What it is:** VROC measures the rate of change in trading volume over a specified period, typically expressed as a percentage. Formula: `((Current Volume - Volume n periods ago) / Volume n periods ago) × 100`
## **Obvious Uses**
**1. Confirming Price Trends**
- Rising VROC with rising prices = strong bullish trend
- Rising VROC with falling prices = strong bearish trend
- Validates that price movements have conviction behind them
**2. Spotting Divergences**
- Price makes new highs but VROC doesn't = weakening momentum
- Price makes new lows but VROC doesn't = potential reversal
**3. Identifying Breakouts**
- Sudden VROC spikes often accompany legitimate breakouts from consolidation patterns
- Helps distinguish real breakouts from false ones
**4. Overbought/Oversold Conditions**
- Extreme VROC readings (very high or very low) suggest exhaustion
- Mean reversion opportunities when volume extremes occur
---
## **Non-Obvious Uses**
**1. Smart Money vs. Dumb Money Detection**
- Declining VROC during price rallies may indicate retail FOMO while institutions distribute
- Rising VROC during selloffs with price stability suggests institutional accumulation
**2. News Impact Measurement**
- Compare VROC before/after earnings or announcements
- Low VROC on "significant" news = market doesn't care (fade the move)
- High VROC = genuine market reaction (respect the move)
**3. Market Regime Changes**
- Persistent shifts in average VROC levels can signal transitions between bull/bear markets
- Declining baseline VROC over months = waning market participation/topping process
**4. Intraday Liquidity Profiling**
- VROC patterns across trading sessions identify best execution times
- Avoid trading when VROC is abnormally low (wider spreads, poor fills)
**5. Sector Rotation Analysis**
- Compare VROC across sector ETFs to identify where capital is flowing
- Rising VROC in defensive sectors + falling VROC in cyclicals = risk-off rotation
**6. Options Expiration Effects**
- VROC typically drops significantly post-options expiration
- Helps avoid false signals from mechanically-driven volume changes
**7. Algorithmic Activity Detection**
- Unusual VROC patterns (regular spikes at specific times) may indicate algo programs
- Can front-run or avoid periods of heavy algorithmic interference
**8. Liquidity Crisis Early Warning**
- Sharp, sustained VROC decline across multiple assets = liquidity withdrawal
- Can precede market stress events before price volatility emerges
**9. Cryptocurrency Wash Trading Detection**
- Comparing VROC across exchanges for same asset
- Discrepancies suggest artificial volume on certain platforms
**10. Pair Trading Optimization**
- Use relative VROC between correlated pairs
- Enter when VROC divergence is extreme, exit when it normalizes
The key to advanced VROC usage is context: combining it with price action, market structure, and other indicators rather than using it in isolation.

HUNT_line [Dr.Forexy]HUNT_line Indicator
📊 **Category:** Price Action & Market Structure
⏰ **Recommended Timeframe:** 5-minute and higher
🎯 **Purpose:** Advanced market structure visualization for professional traders
⸻
⚡ **Key Features:**
• Break of Structure (BOS) and Change of Character (CHOCH) detection
• Internal & Swing Market Structure analysis
• Order Blocks identification with smart filtering
• Fair Value Gaps (FVG) visualization
• Premium/Discount Zones
• Multi-timeframe support
• Real-time structure alerts
⸻
🛠 **How to Use:**
1. Apply on 5M or higher timeframes for best results
2. Monitor BOS/CHOCH for trend direction changes
3. Use Order Blocks as potential support/resistance areas
4. Watch for FVG fills as price inefficiency zones
5. Combine multiple confluences for higher probability setups
⸻
⚠️ **Risk Disclaimer:**
This indicator is for educational purposes only.
Not financial advice. Always conduct your own research.
⸻
🔹 **Credits:**
Inspired by LuxAlgo's "Smart Money Concepts" with custom improvements

SMC - Institutional Confidence Oscillator [PhenLabs]📊 Institutional Confidence Oscillator
Version: PineScript™v6
📌 Description
The Institutional Confidence Oscillator (ICO) revolutionizes market analysis by automatically detecting and evaluating institutional activity at key support and resistance levels using our own in-house detection system. This sophisticated indicator combines volume analysis, volatility measurements, and mathematical confidence algorithms to provide real-time readings of institutional sentiment and zone strength.
Using our advanced thin liquidity detection, the ICO identifies high-volume, narrow-range bars that signal institutional zone formation, then tracks how these zones perform under market pressure. The result is a dual-wave confidence oscillator that shows traders when institutions are actively defending price levels versus when they’re abandoning positions.
The indicator transforms complex institutional behavior patterns into clear, actionable confidence percentiles, helping traders align with smart money movements and avoid common retail trading pitfalls.
🚀 Points of Innovation
Automated thin liquidity zone detection using volume threshold multipliers and zone size filtering
Dual-sided confidence tracking for both support and resistance levels simultaneously
Sigmoid function processing for enhanced mathematical accuracy in confidence calculations
Real-time institutional defense pattern analysis through complete test cycles
Advanced visual smoothing options with multiple algorithmic methods (EMA, SMA, WMA, ALMA)
Integrated momentum indicators and gradient visualization for enhanced signal clarity
🔧 Core Components
Volume Threshold System: Analyzes volume ratios against baseline averages to identify institutional activity spikes
Zone Detection Algorithm: Automatically identifies thin liquidity zones based on customizable volume and size parameters
Confidence Lifecycle Engine: Tracks institutional defense patterns through complete observation windows
Mathematical Processing Core: Uses sigmoid functions to convert raw market data into normalized confidence percentiles
Visual Enhancement Suite: Provides multiple smoothing methods and customizable display options for optimal chart interpretation
🔥 Key Features
Auto-Detection Technology: Automatically scans for institutional zones without manual intervention, saving analysis time
Dual Confidence Tracking: Simultaneously monitors both support and resistance institutional activity for comprehensive market view
Smart Zone Validation: Evaluates zone strength through volume analysis, adverse excursion measurement, and defense success rates
Customizable Parameters: Extensive input options for volume thresholds, observation windows, and visual preferences
Real-Time Updates: Continuously processes market data to provide current institutional confidence readings
Enhanced Visualization: Features gradient fills, momentum indicators, and information panels for clear signal interpretation
🎨 Visualization
Dual Oscillator Lines: Support confidence (cyan) and resistance confidence (red) plotted as percentage values 0-100%
Gradient Fill Areas: Color-coded regions showing confidence dominance and strength levels
Reference Grid Lines: Horizontal markers at 25%, 50%, and 75% levels for easy interpretation
Information Panel: Real-time display of current confidence percentiles with color-coded dominance indicators
Momentum Indicators: Rate of change visualization for confidence trends
Background Highlights: Extreme confidence level alerts when readings exceed 80%
📖 Usage Guidelines
Auto-Detection Settings
Use Auto-Detection
Default: true
Description: Enables automatic thin liquidity zone identification based on volume and size criteria
Volume Threshold Multiplier
Default: 6.0, Range: 1.0+
Description: Controls sensitivity of volume spike detection for zone identification, higher values require more significant volume increases
Volume MA Length
Default: 15, Range: 1+
Description: Period for volume moving average baseline calculation, affects volume spike sensitivity
Max Zone Height %
Default: 0.5%, Range: 0.05%+
Description: Filters out wide price bars, keeping only thin liquidity zones as percentage of current price
Confidence Logic Settings
Test Observation Window
Default: 20 bars, Range: 2+
Description: Number of bars to monitor zone tests for confidence calculation, longer windows provide more stable readings
Clean Break Threshold
Default: 1.5 ATR, Range: 0.1+
Description: ATR multiple required for zone invalidation, higher values make zones more persistent
Visual Settings
Smoothing Method
Default: EMA, Options: SMA/EMA/WMA/ALMA
Description: Algorithm for signal smoothing, EMA responds faster while SMA provides more stability
Smoothing Length
Default: 5, Range: 1-50
Description: Period for smoothing calculation, higher values create smoother lines with more lag
✅ Best Use Cases
Trending market analysis where institutional zones provide reliable support/resistance levels
Breakout confirmation by validating zone strength before position entry
Divergence analysis when confidence shifts between support and resistance levels
Risk management through identification of high-confidence institutional backing
Market structure analysis for understanding institutional sentiment changes
⚠️ Limitations
Performs best in liquid markets with clear institutional participation
May produce false signals during low-volume or holiday trading periods
Requires sufficient price history for accurate confidence calculations
Confidence readings can fluctuate rapidly during high-impact news events
Manual fallback zones may not reflect actual institutional activity
💡 What Makes This Unique
Automated Detection: First Pine Script indicator to automatically identify thin liquidity zones using sophisticated volume analysis
Dual-Sided Analysis: Simultaneously tracks institutional confidence for both support and resistance levels
Mathematical Precision: Uses sigmoid functions for enhanced accuracy in confidence percentage calculations
Real-Time Processing: Continuously evaluates institutional defense patterns as market conditions change
Visual Innovation: Advanced smoothing options and gradient visualization for superior chart clarity
🔬 How It Works
1. Zone Identification Process:
Scans for high-volume bars that exceed the volume threshold multiplier
Filters bars by maximum zone height percentage to identify thin liquidity conditions
Stores qualified zones with proximity threshold filtering for relevance
2. Confidence Calculation Process:
Monitors price interaction with identified zones during observation windows
Measures volume ratios and adverse excursions during zone tests
Applies sigmoid function processing to normalize raw data into confidence percentiles
3. Real-Time Analysis Process:
Continuously updates confidence readings as new market data becomes available
Tracks institutional defense success rates and zone validation patterns
Provides visual and numerical feedback through the oscillator display
💡 Note:
The ICO works best when combined with traditional technical analysis and proper risk management. Higher confidence readings indicate stronger institutional backing but should be confirmed with price action and volume analysis. Consider using multiple timeframes for comprehensive market structure understanding.

IFVG by Toño# IFVG by Toño - Pine Script Indicator
## Overview
This Pine Script indicator identifies and visualizes **Fair Value Gaps (FVG)** and **Inverted Fair Value Gaps (IFVG)** on trading charts. It provides advanced analysis of price inefficiencies and their subsequent inversions when mitigated.
## Key Features
### 1. Fair Value Gap (FVG) Detection
- **Bullish FVG**: Detected when `low > high ` (gap between current low and high of 2 bars ago)
- **Bearish FVG**: Detected when `high < low ` (gap between current high and low of 2 bars ago)
- Visual representation using colored rectangles (green for bullish, red for bearish)
### 2. Inverted Fair Value Gap (IFVG) Creation
- **IFVG Formation**: When a FVG gets mitigated (price fills the gap with candle body), an IFVG is created
- **Color Inversion**: The IFVG takes the opposite color of the original FVG
- Mitigated bullish FVG → Creates red (bearish) IFVG
- Mitigated bearish FVG → Creates green (bullish) IFVG
- **Mitigation Logic**: Uses only candle body (not wicks) to determine when a FVG is filled
### 3. Customizable Display Options
- **Show Normal FVG**: Toggle visibility of regular Fair Value Gaps
- **Show IFVG**: Toggle visibility of Inverted Fair Value Gaps
- **Smart FVG Display**: Even when "Show Normal FVG" is disabled, FVGs that are part of IFVGs remain visible
- **Extension Control**: Option to extend FVGs until they are mitigated
### 4. IFVG Extension Methods
- **Full Cross Method**: IFVG remains active until price completely crosses through it (including wicks)
- **Number of Bars Method**: IFVG remains active for a specified number of bars (1-100)
### 5. Visual Mitigation Signals
- **Cross Markers**: Shows X-shaped markers when IFVGs are mitigated
- Green cross above bar: Bearish IFVG mitigated
- Red cross below bar: Bullish IFVG mitigated
### 6. Comprehensive Alert System
- **IFVG Formation Alerts**: Notifications when new IFVGs are created
- **IFVG Mitigation Alerts**: Notifications when IFVGs are filled/mitigated
- **Separate Controls**: Individual toggles for bullish and bearish IFVG alerts
## How It Works
### Step-by-Step Process:
1. **FVG Detection**: Script continuously scans for 3-bar patterns that create price gaps
2. **FVG Tracking**: Each FVG is stored with its coordinates, type, and status
3. **Mitigation Monitoring**: Script watches for candle bodies that fill the FVG
4. **IFVG Creation**: Upon mitigation, creates an IFVG with opposite polarity at the same location
5. **IFVG Management**: Tracks and extends IFVGs according to chosen method
6. **Visual Updates**: Dynamically updates colors and visibility based on user settings
## Use Cases
- **Support/Resistance Analysis**: IFVGs often act as strong support/resistance levels
- **Market Structure Understanding**: Helps identify how market inefficiencies get filled and reversed
- **Entry/Exit Timing**: Can be used to time entries around IFVG formations or mitigations
- **Confluence Analysis**: Combine with other technical analysis tools for stronger signals
## Configuration Parameters
- **Colors**: Customizable colors for bullish/bearish FVGs and IFVGs
- **Extension**: Choose how long to display gaps on the chart
- **Alerts**: Full control over notification preferences
- **Visual Clarity**: Options to show/hide different gap types for cleaner charts
## Technical Specifications
- **Pine Script Version**: 5
- **Overlay**: True (displays directly on price chart)
- **Max Boxes**: 500 (supports up to 500 simultaneous gaps)
- **Performance**: Optimized array management for smooth operation
This indicator is particularly valuable for traders who use **Smart Money Concepts (SMC)** and **Inner Circle Trader (ICT)** methodologies, as it provides clear visualization of how institutional order flow creates and fills market inefficiencies.

SCTI-D1SCTI-D1 Indicator Introduction / 指标简介
The SCTI-D1 (Smart Composite Trading Indicator - Daily) is a comprehensive, multi-feature trading tool designed for serious traders who demand depth, flexibility, and clarity in their market analysis. This indicator combines several powerful concepts into one seamless workflow, including:
Multiple EMA Systems with customizable lengths and visibility
PMA (Projected Moving Average) with fill options between lines
VWAP with configurable anchors and deviation bands
Divergence Detection for MACD and Histogram
Volume Profile with node detection (peaks, troughs, highs, lows)
Smart Money Concepts including order blocks, fair value gaps, equal highs/lows, and market structure shifts
Whether you trade stocks, forex, or cryptocurrencies, the SCTI-D1 helps you identify key levels, track institutional activity, and spot high-probability reversal signals—all in one clean, customizable interface.
SCTI-D1 指标简介
SCTI-D1(智能综合交易指标 - 日线版)是一款功能全面的交易工具,专为需要深度、灵活性和清晰市场分析的专业交易者设计。该指标将多种强大概念融合在一个流畅的工作流程中,包括:
多组EMA系统,可自定义长度和显示
PMA(投影移动平均线),支持均线间填充色
VWAP,可配置锚定周期和偏差带
背离检测,支持MACD和柱状图
成交量分布,支持节点检测(峰值、谷值、最高、最低)
聪明钱概念,包括订单块、公允价值缺口、等高/等低和市场结构转换
无论您交易股票、外汇还是加密货币,SCTI-D1 都能帮助您识别关键水平、跟踪机构资金动向并发现高概率反转信号——所有功能均集成在一个清晰可定制的界面中。

Smarter Money Concepts - Wyckoff Springs & Upthrusts [PhenLabs]📊Smarter Money Concepts - Wyckoff Springs & Upthrusts
Version: PineScript™v6
📌Description
Discover institutional manipulation in real-time with this advanced Wyckoff indicator that detects Springs (accumulation phases) and Upthrusts (distribution phases). It identifies when price tests support or resistance on high volume, followed by a strong recovery, signaling potential reversals where smart money accumulates or distributes positions. This tool solves the common problem of missing these subtle phase transitions, helping traders anticipate trend changes and avoid traps in volatile markets.
By combining volume spike detection, ATR-normalized recovery strength, and a sigmoid probability model, it filters out weak signals and highlights only high-confidence setups. Whether you’re swing trading or day trading, this indicator provides clear visual cues to align with institutional flows, improving entry timing and risk management.
🚀Points of Innovation
Sigmoid-based probability threshold for signal filtering, ensuring only statistically significant Wyckoff patterns trigger alerts
ATR-normalized recovery measurement that adapts to market volatility, unlike static recovery checks in traditional indicators
Customizable volume spike multiplier to distinguish institutional volume from retail noise
Integrated dashboard legend with position and size options for personalized chart visualization
Hidden probability plots for advanced users to analyze underlying math without chart clutter
🔧Core Components
Support/Resistance Calculator: Scans a user-defined lookback period to establish dynamic levels for Spring and Upthrust detection
Volume Spike Detector: Compares current volume to a 10-period SMA, multiplied by a configurable factor to identify significant surges
Recovery Strength Analyzer: Uses ATR to measure price recovery after breaks, normalizing for different market conditions
Probability Model: Applies sigmoid function to combine volume and recovery data, generating a confidence score for each potential signal
🔥Key Features
Spring Detection: Spots accumulation when price dips below support but recovers strongly, helping traders enter longs at potential bottoms
Upthrust Detection: Identifies distribution when price spikes above resistance but falls back, alerting to possible short opportunities at tops
Customizable Inputs: Adjust lookback, volume multiplier, ATR period, and probability threshold to match your trading style and market
Visual Signals: Clear + (green) and - (red) labels on charts for instant recognition of accumulation and distribution phases
Alert System: Triggers notifications for signals and probability thresholds, keeping you informed without constant monitoring
🎨Visualization
Spring Signal: Green upward label (+) below the bar, indicating strong recovery after support break for accumulation
Upthrust Signal: Red downward label (-) above the bar, showing failed breakout above resistance for distribution
Dashboard Legend: Customizable table explaining signals, positioned anywhere on the chart for quick reference
📖Usage Guidelines
Core Settings
Support/Resistance Lookback
Default: 20
Range: 5-50
Description: Sets bars back for S/R levels; lower for recent sensitivity, higher for stable long-term zones – ideal for spotting Wyckoff phases
Volume Spike Multiplier
Default: 1.5
Range: 1.0-3.0
Description: Multiplies 10-period volume SMA; higher values filter to significant spikes, confirming institutional involvement in patterns
ATR for Recovery Measurement
Default: 5
Range: 2-20
Description: ATR period for recovery strength; shorter for volatile markets, longer for smoother analysis of post-break recoveries
Phase Transition Probability Threshold
Default: 0.9
Range: 0.5-0.99
Description: Minimum sigmoid probability for signals; higher for strict filtering, ensuring only high-confidence Wyckoff setups
Display Settings
Dashboard Position
Default: Top Right
Range: Various positions
Description: Places legend table on chart; choose based on layout to avoid overlapping price action
Dashboard Text Size
Default: Normal
Range: Auto to Huge
Description: Adjusts legend text; larger for visibility, smaller for minimal space use
✅Best Use Cases
Swing Trading: Identify Springs for long entries in downtrends turning to accumulation
Day Trading: Catch Upthrusts for short scalps during intraday distribution at resistance
Trend Reversal Confirmation: Use in conjunction with other indicators to validate phase shifts in ranging markets
Volatility Plays: Spot signals in high-volume environments like news events for quick reversals
⚠️Limitations
May produce false signals in low-volume or sideways markets where volume spikes are unreliable
Depends on historical data, so performance varies in unprecedented market conditions or gaps
Probability model is statistical, not predictive, and cannot account for external factors like news
💡What Makes This Unique
Probability-Driven Filtering: Sigmoid model combines multiple factors for superior signal quality over basic Wyckoff detectors
Adaptive Recovery: ATR normalization ensures reliability across assets and timeframes, unlike fixed-threshold tools
User-Centric Design: Tooltips, customizable dashboard, and alerts make it accessible yet powerful for all trader levels
🔬How It Works
Calculate S/R Levels:
Uses the highest high and the lowest low over the lookback period to set dynamic zones
Establishes baseline for detecting breaks in Wyckoff patterns
Detect Breaks and Recovery:
Checks for price breaking support/resistance, then recovering on volume
Measures recovery strength via ATR for volatility adjustment
Apply Probability Model:
Combines volume spike and recovery into a sigmoid function for confidence score
Triggers signal only if above threshold, plotting visuals and alerts
💡Note:
For optimal results, combine with price action analysis and test settings on historical charts. Remember, Wyckoff patterns are most effective in trending markets – use lower probability thresholds for practice, then increase for live trading to focus on high-quality setups.

Dynamic S/R System - Pivot + ChannelDynamic S/R System - Pivot + Channel
A comprehensive Support & Resistance indicator combining dual methodologies for institutional-grade price level analysis
📊 CORE FEATURES
Dual Detection System
• Pivot-Based Levels - Historical turning points with intelligent touch counting
• Dynamic Channel S/R - Trend-aware linear regression boundaries
• Smart Level Management - Auto-merges similar levels, removes weak/outdated ones
Volume Integration
• Multi-timeframe volume analysis using EMA oscillator and spike detection
• Volume confirmation for all breakout signals to filter false moves
• Real-time volume status (Normal/High/Spike) in live information panel
Intelligent Touch Counting
• Automatic level validation through touch frequency analysis
• Strength classification with visual differentiation (colors/thickness)
• Level labels showing exact touch count (S3, R5, etc.)
━━━━━━━━━━━━━━━━━━━━━━━━━━━━━━━━━━━━━━━━━━━━━━━━━━━━━━━━━━━━━━━━━━━━━━━━━━━━━━━
🎨 VISUAL ELEMENTS
Line System
Solid Lines: Pivot-based S/R levels
Dashed Lines: Dynamic channel boundaries
Color Coding:
• 🔵 Blue/🔴 Red: Standard support/resistance
• 🟠 Orange: Strong levels (multiple touches)
• 🟣 Purple: Channel S/R levels
Signal Labels
• "B" - Pivot S/R breakout with volume confirmation
• "CB" - Channel boundary breakout
• "Bull/Bear Wick" - False breakout detection (wick rejections)
Information Panel
Real-time analysis displays:
• Total resistance/support levels detected
• Closest S/R levels to current price
• Volume status and position relative to levels
• Current market position assessment
━━━━━━━━━━━━━━━━━━━━━━━━━━━━━━━━━━━━━━━━━━━━━━━━━━━━━━━━━━━━━━━━━━━━━━━━━━━━━━━
✅ KEY ADVANTAGES
Multi-Method Validation
Combines historical pivot analysis with dynamic trend channels for comprehensive market view
False Breakout Protection
• Volume confirmation requirements
• Wick analysis to identify failed attempts
• Multiple validation criteria before signal generation
Adaptive Level Management
• Automatically updates as new pivots form
• Removes outdated/weak levels
• Maintains clean, relevant level display
Institutional-Grade Analysis
• Touch counting reveals institutional respect levels
• Volume integration shows smart money activity
• Strength classification identifies high-probability zones
━━━━━━━━━━━━━━━━━━━━━━━━━━━━━━━━━━━━━━━━━━━━━━━━━━━━━━━━━━━━━━━━━━━━━━━━━━━━━━━
⏰ OPTIMAL USE CASES
Best Timeframes
• Daily - Primary recommendation for swing trading
• 4-Hour - Intraday analysis and entries
• Weekly - Long-term position planning
Ideal Markets
• Crypto pairs (especially ETH/BTC, BTC/USD)
• Forex majors with good volume data
• Large-cap stocks with institutional participation
Trading Applications
• Entry/exit planning around key S/R levels
• Breakout confirmation with volume validation
• Risk management using nearest S/R for stops
• Trend analysis through channel dynamics
━━━━━━━━━━━━━━━━━━━━━━━━━━━━━━━━━━━━━━━━━━━━━━━━━━━━━━━━━━━━━━━━━━━━━━━━━━━━━━━
⚙️ CONFIGURATION GUIDELINES
Conservative Setup (Higher Confidence)
Min Pivot Strength: 3-4
Volume Threshold: 25-30%
Max Levels: 6-8
Aggressive Setup (More Signals)
Min Pivot Strength: 2
Volume Threshold: 15-20%
Max Levels: 10-12
🔔 ALERT SYSTEM
Breakout Alerts
• Resistance/Support breaks with volume confirmation
• Channel boundary violations
• Approaching strong S/R levels
Advanced Notifications
• Strong level approaches (within 0.5% of price)
• False breakout detection
• Volume spike confirmations
📈 TRADING STRATEGY GUIDE
Entry Strategy
1. Wait for price to approach identified S/R level
2. Confirm with volume analysis (spike/high volume preferred)
3. Watch for wick formations indicating rejection
4. Enter on confirmed breakout with volume or bounce with rejection
Risk Management
• Use nearest S/R level for stop placement
• Scale position size based on level strength (touch count)
• Monitor volume confirmation for exit signals
Market Context
• Combine with higher timeframe trend analysis
• Consider overall market sentiment and volatility
• Use channel direction for bias confirmation
Transform complex S/R analysis into actionable trading intelligence with institutional-level insights for professional trading decisions.

Chaikin Oscillator Enhanced📊 What Is the Chaikin Oscillator?
The Chaikin Oscillator is a momentum indicator that helps traders understand the strength of buying and selling pressure in the market, based on volume and price movement.
It is calculated as the difference between two moving averages (short-term and long-term) of the Accumulation/Distribution Line (A/D Line). This line combines price and volume to show whether money is flowing into or out of an asset.
________________________________________
🧠 Simple Concept
• When big traders are buying, they usually do so with volume support—the Chaikin Oscillator picks this up.
• When volume is rising but price is falling, or vice versa, it shows hidden strength or weakness.
So, this indicator helps you see what the smart money is doing, even if the price isn’t moving much.
________________________________________
🛠️ How It Works
• Oscillator Value Above Zero → More buying pressure (bullish).
• Oscillator Value Below Zero → More selling pressure (bearish).
• Crossing above zero → A potential buy signal.
• Crossing below zero → A potential sell signal.
The histogram (vertical bars) in the indicator changes color:
• Green bars = Positive momentum.
• Red bars = Negative momentum.
________________________________________
🎯 How Traders Use It for Entry and Exit
✅ For Entries:
• Buy Entry: When the oscillator crosses above the zero line and the bars turn green, it means buyers are stepping in with volume.
• For better confirmation, combine it with price breaking above a resistance level.
❌ For Exits or Shorts:
• Sell Exit or Short Entry: When the oscillator crosses below the zero line and bars turn red, it suggests selling pressure is growing.
• If the price is also below support, it’s a stronger signal.
________________________________________
🔍 Example Use Case:
1. You’re watching a stock or crypto that's been going sideways.
2. Suddenly, the Chaikin Oscillator crosses above zero, and green bars appear.
3. That’s your early clue that big buyers might be entering.
4. If price confirms this with a breakout, you can enter a long position.
________________________________________
🌐 Where Is It Useful?
The Chaikin Oscillator is great for:
• Stocks (especially volume-heavy large caps)
• ETFs
• Cryptocurrency (on exchanges that provide volume data)
• Forex – less reliable unless volume is proxy-based
⚠️ Important: It won’t work well on instruments where volume data is missing or unreliable (like some CFDs or synthetic assets).
________________________________________
🧭 Pro Tips for Using It:
• Combine it with support/resistance, moving averages, or candlestick patterns.
• Avoid trading only based on this indicator—use it as confirmation.
• Use the alerts (added in the script) so you don’t miss key movements.
________________________________________
